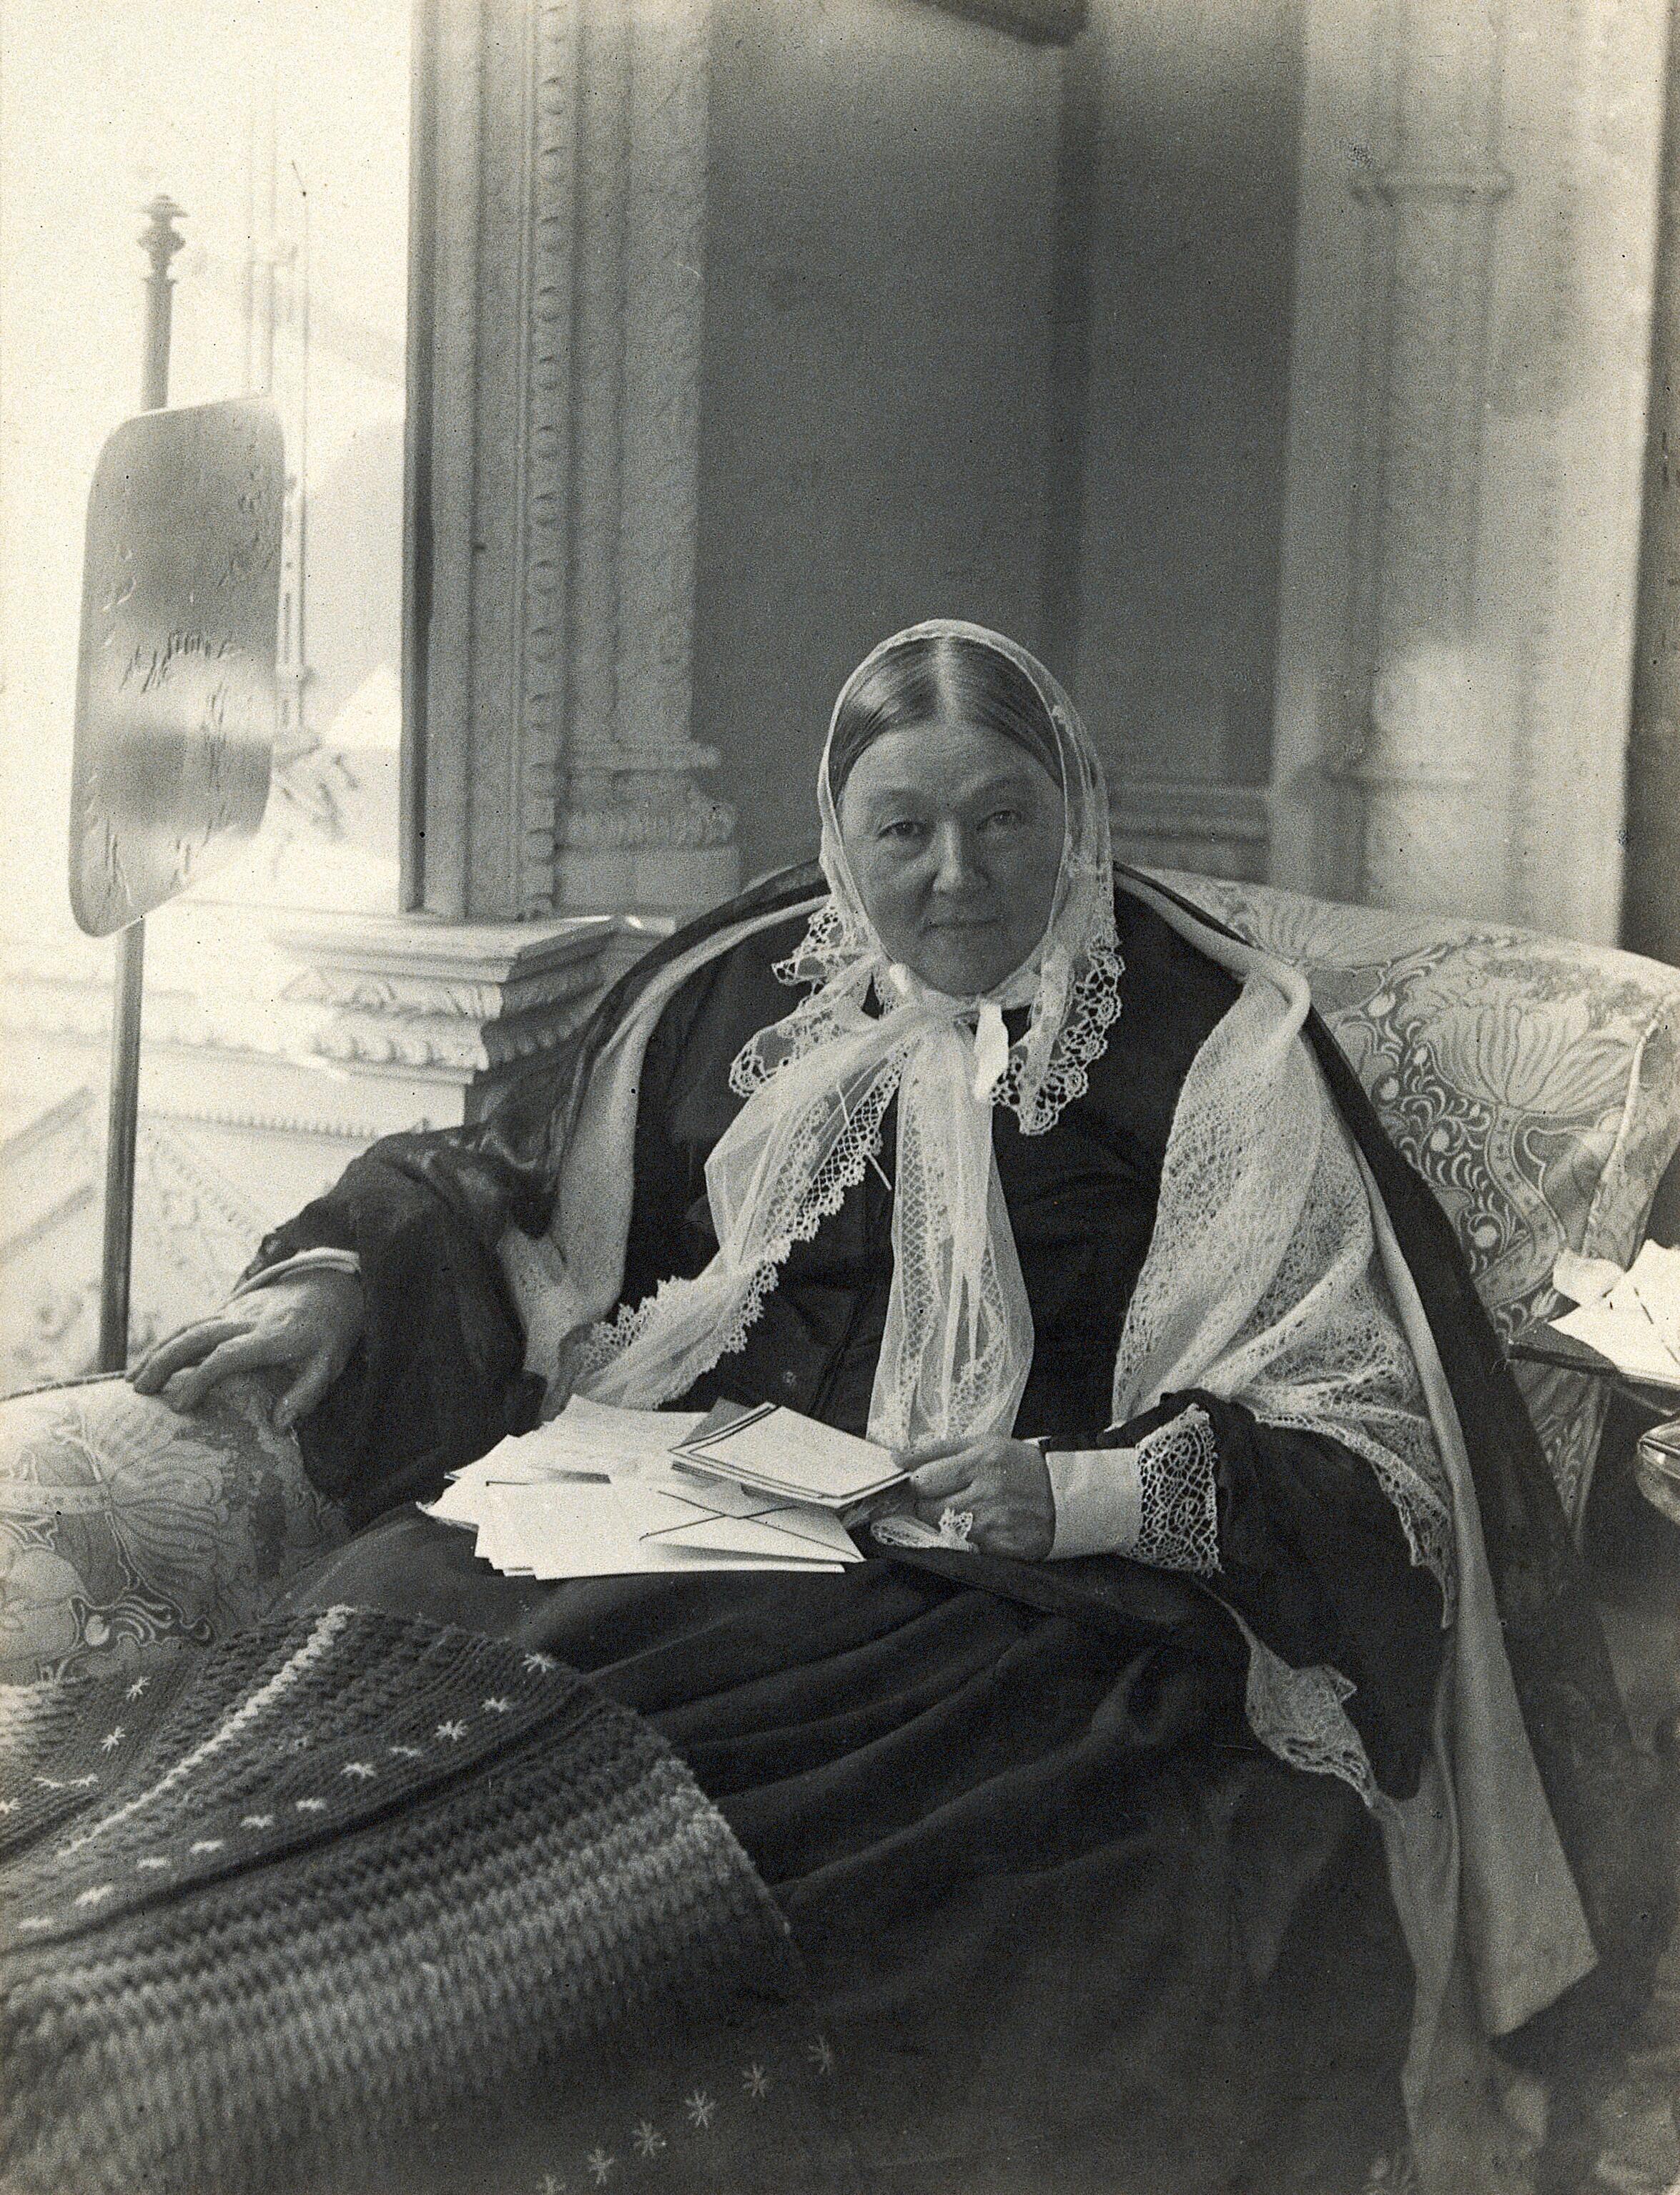
Famous for her work in reforming nursing, Florence Nightingale (12 May 1820 – 13 August 1910) was a keen and skilled statistician. Nightingale came to prominence while serving as a manager and trainer of nurses during the Crimean War (October 1853 to February 1856), in which she organised care for wounded soldiers at Constantinople.
“The Lady with the Lamp” published data visualisations of the preventable deaths from awful conditions she saw in the fetid and ill-equipped hospitals. She used recent data to persuade the Government to improve army hygiene, much in the same way that WB Du Bois used illustrated data to show the state of black life in America. “I wanted to set down its aim and method in some outstanding way which would bring my work to notice by the thinking world,” he wrote.
Both Nightingale and Du Bois realised that statistics could be used by politicians and officials as a rational means for decision making. Illustrate the data with colours and shapes, and the lot of fellow humanity might become easier to convey.
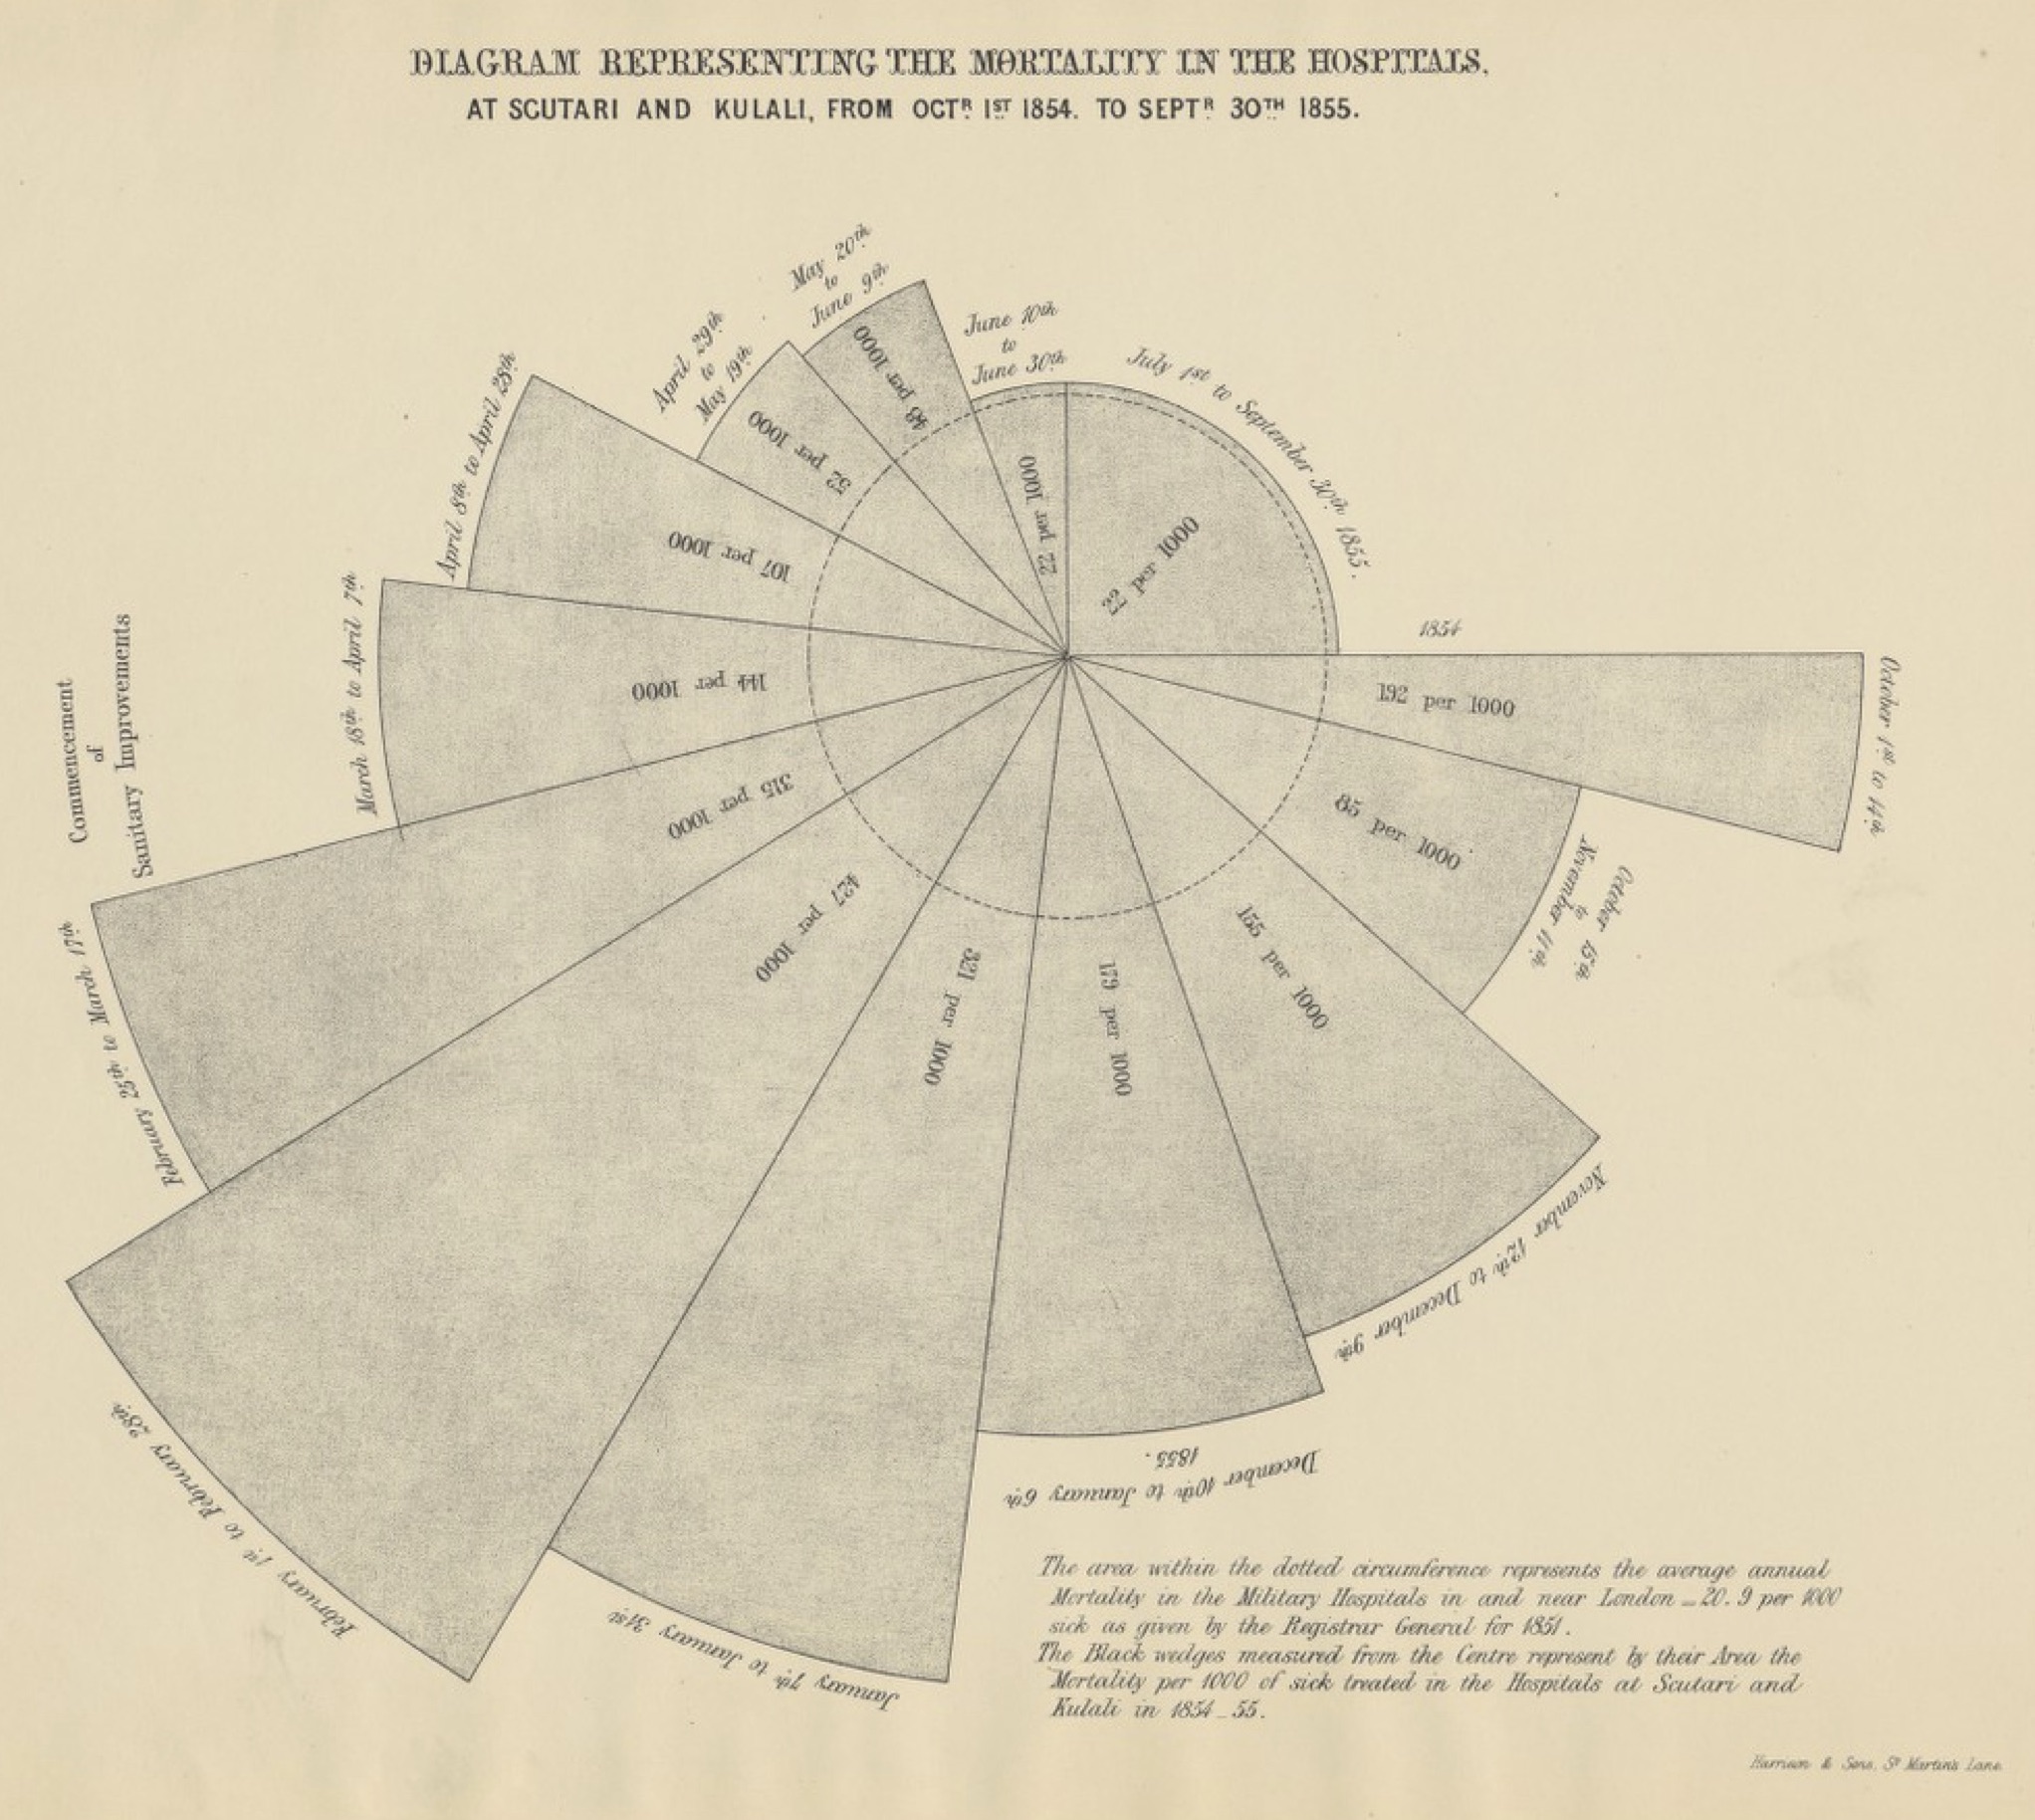
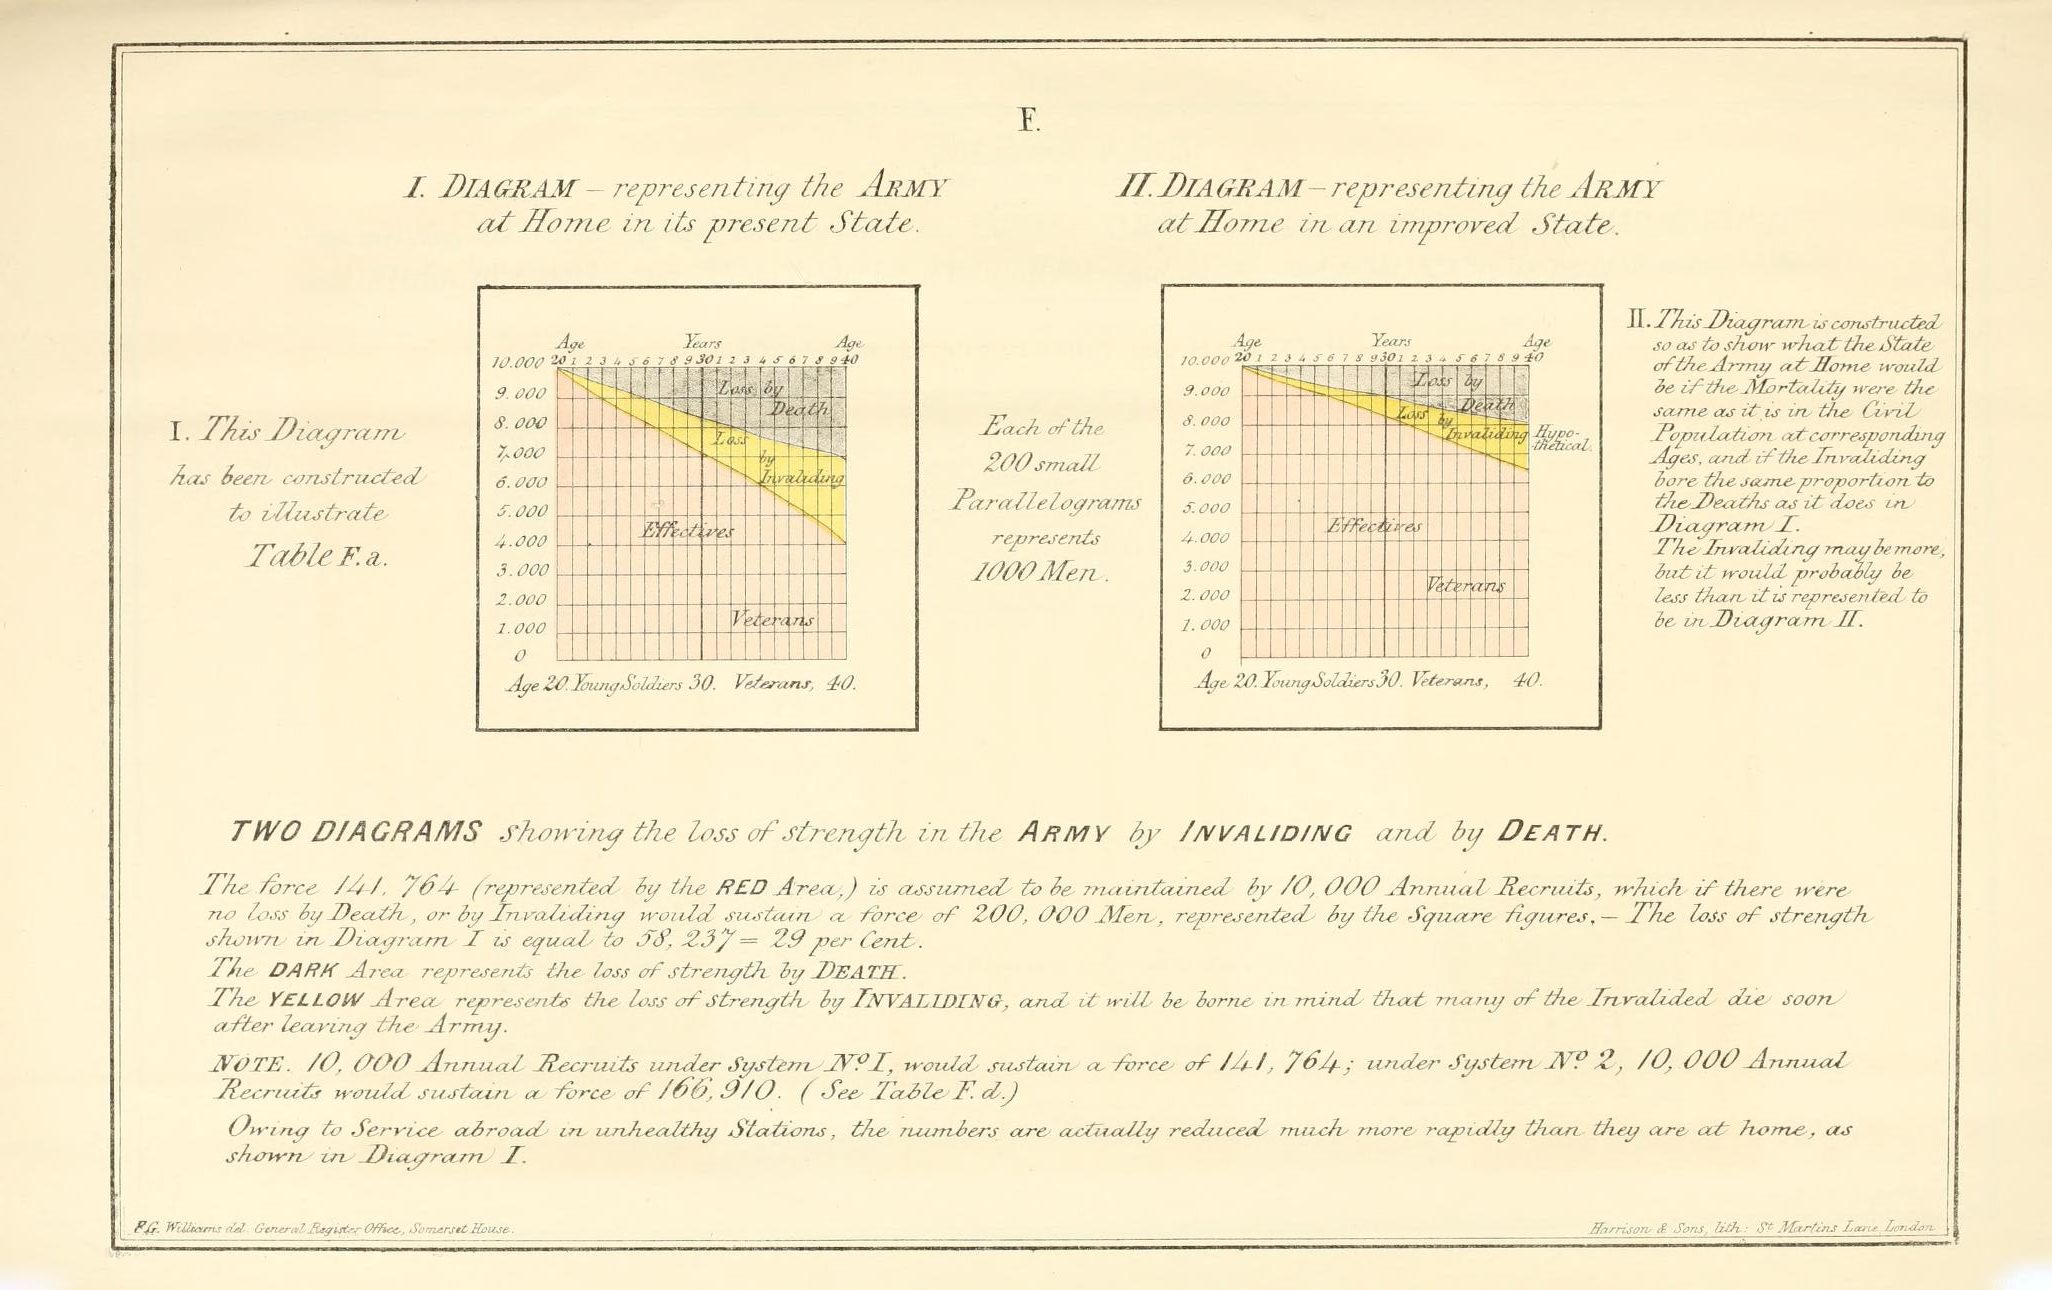
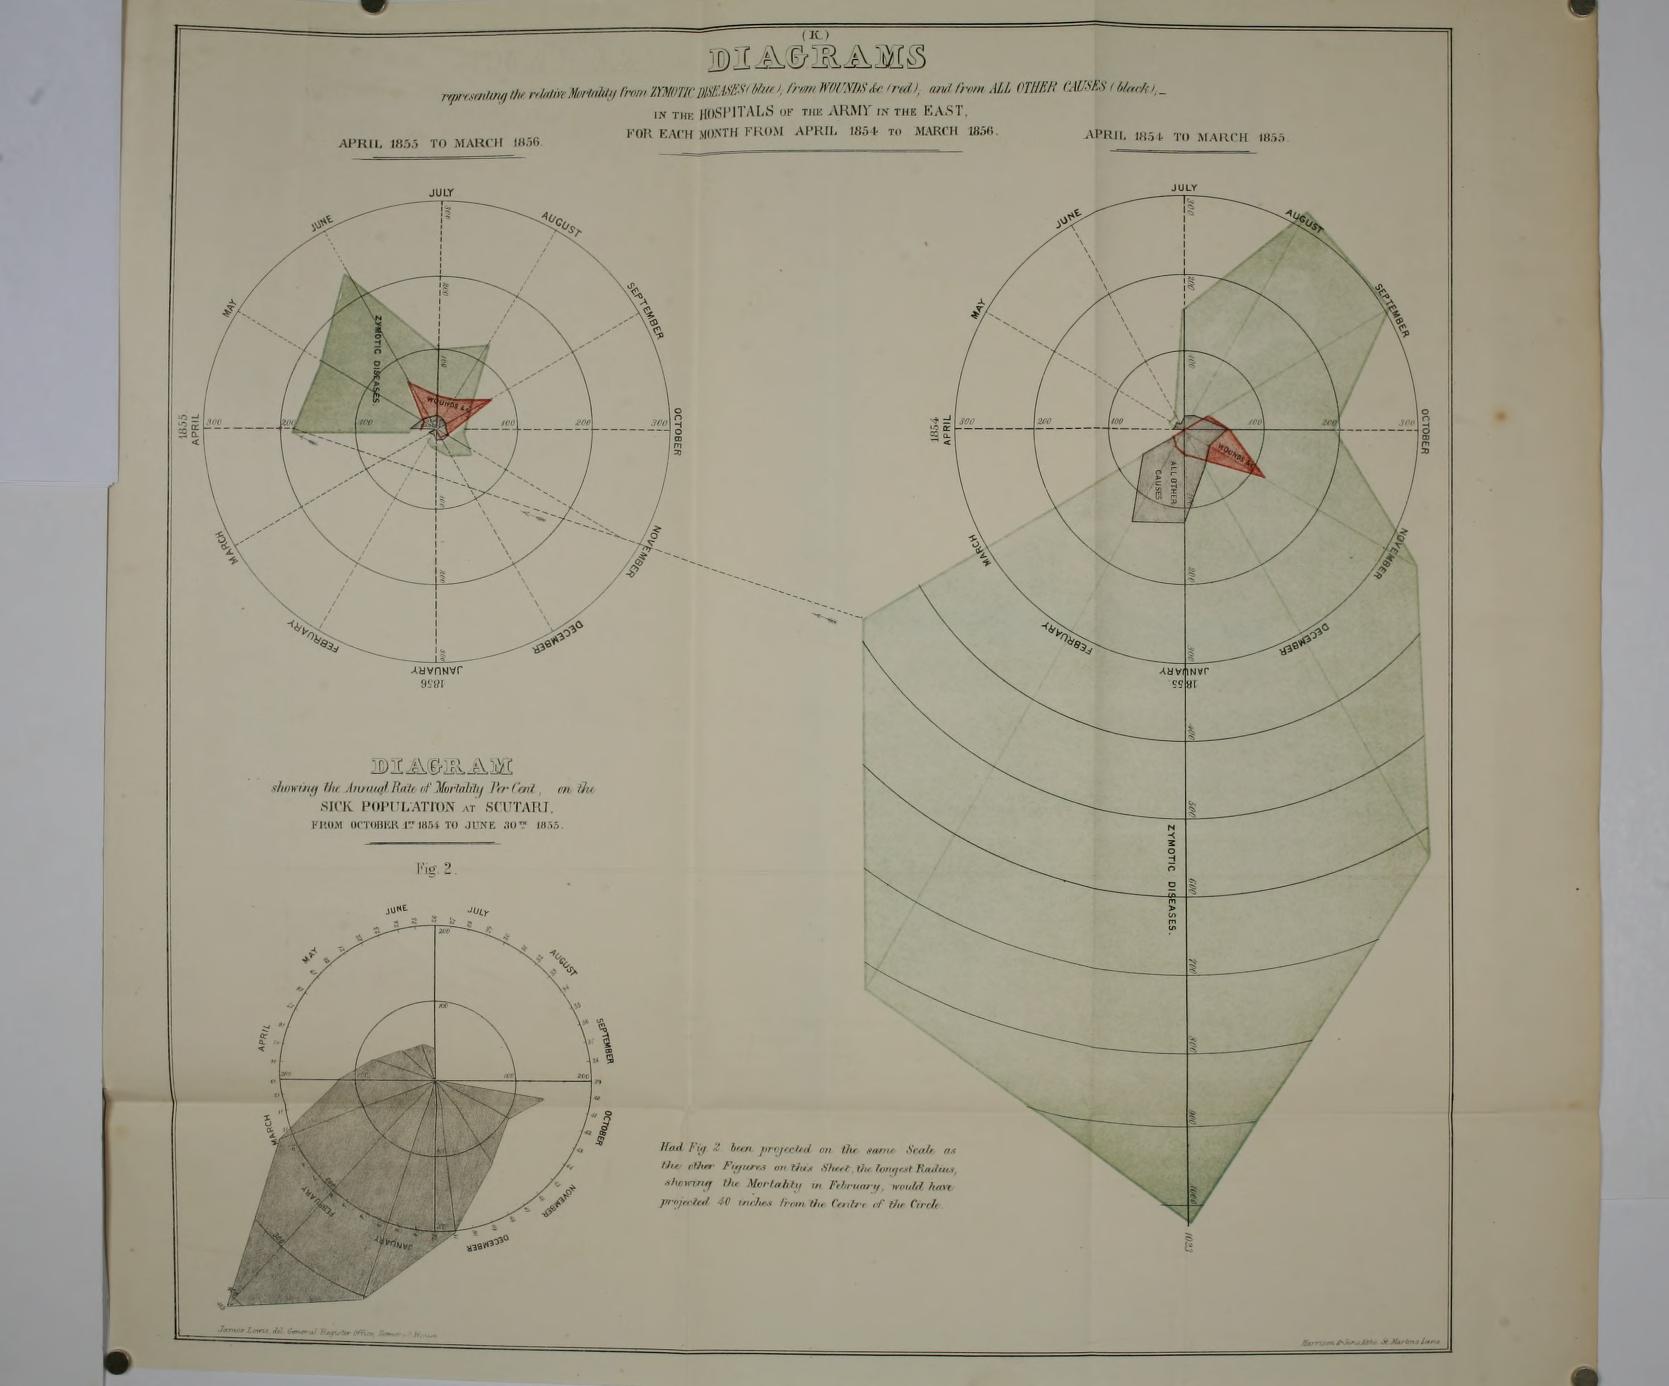
In 1858, Nightingale published Notes on Matters Affecting the Health, Efficiency, and Hospital Administration of the British Army. Founded Chiefly on the Experience of the Late War. Presented by Request to the Secretary of State for War, her friend Sidney Herbert, the privately printed work contained a colour statistical graphic entitled “Diagram of the Causes of Mortality in the Army of the East”. You can see it below. The style is variously called the Rose Diagram, the Coxcomb, or, as she preferred it, the Wedges
The diagram on the right below shows the increasing death toll among British troops in Crimea caused by infectious diseases month on month from April 1854 – the bigger the blue area, the more deaths.
The diagram on the left shows the deaths from April 1855 onwards once basic cleaning measures were put into place. Before methods of infections were understood, Nightingale showed what an undeniable impact sanitation had in controlling diseases. The form became known as the ‘Nightingale rose diagram’.
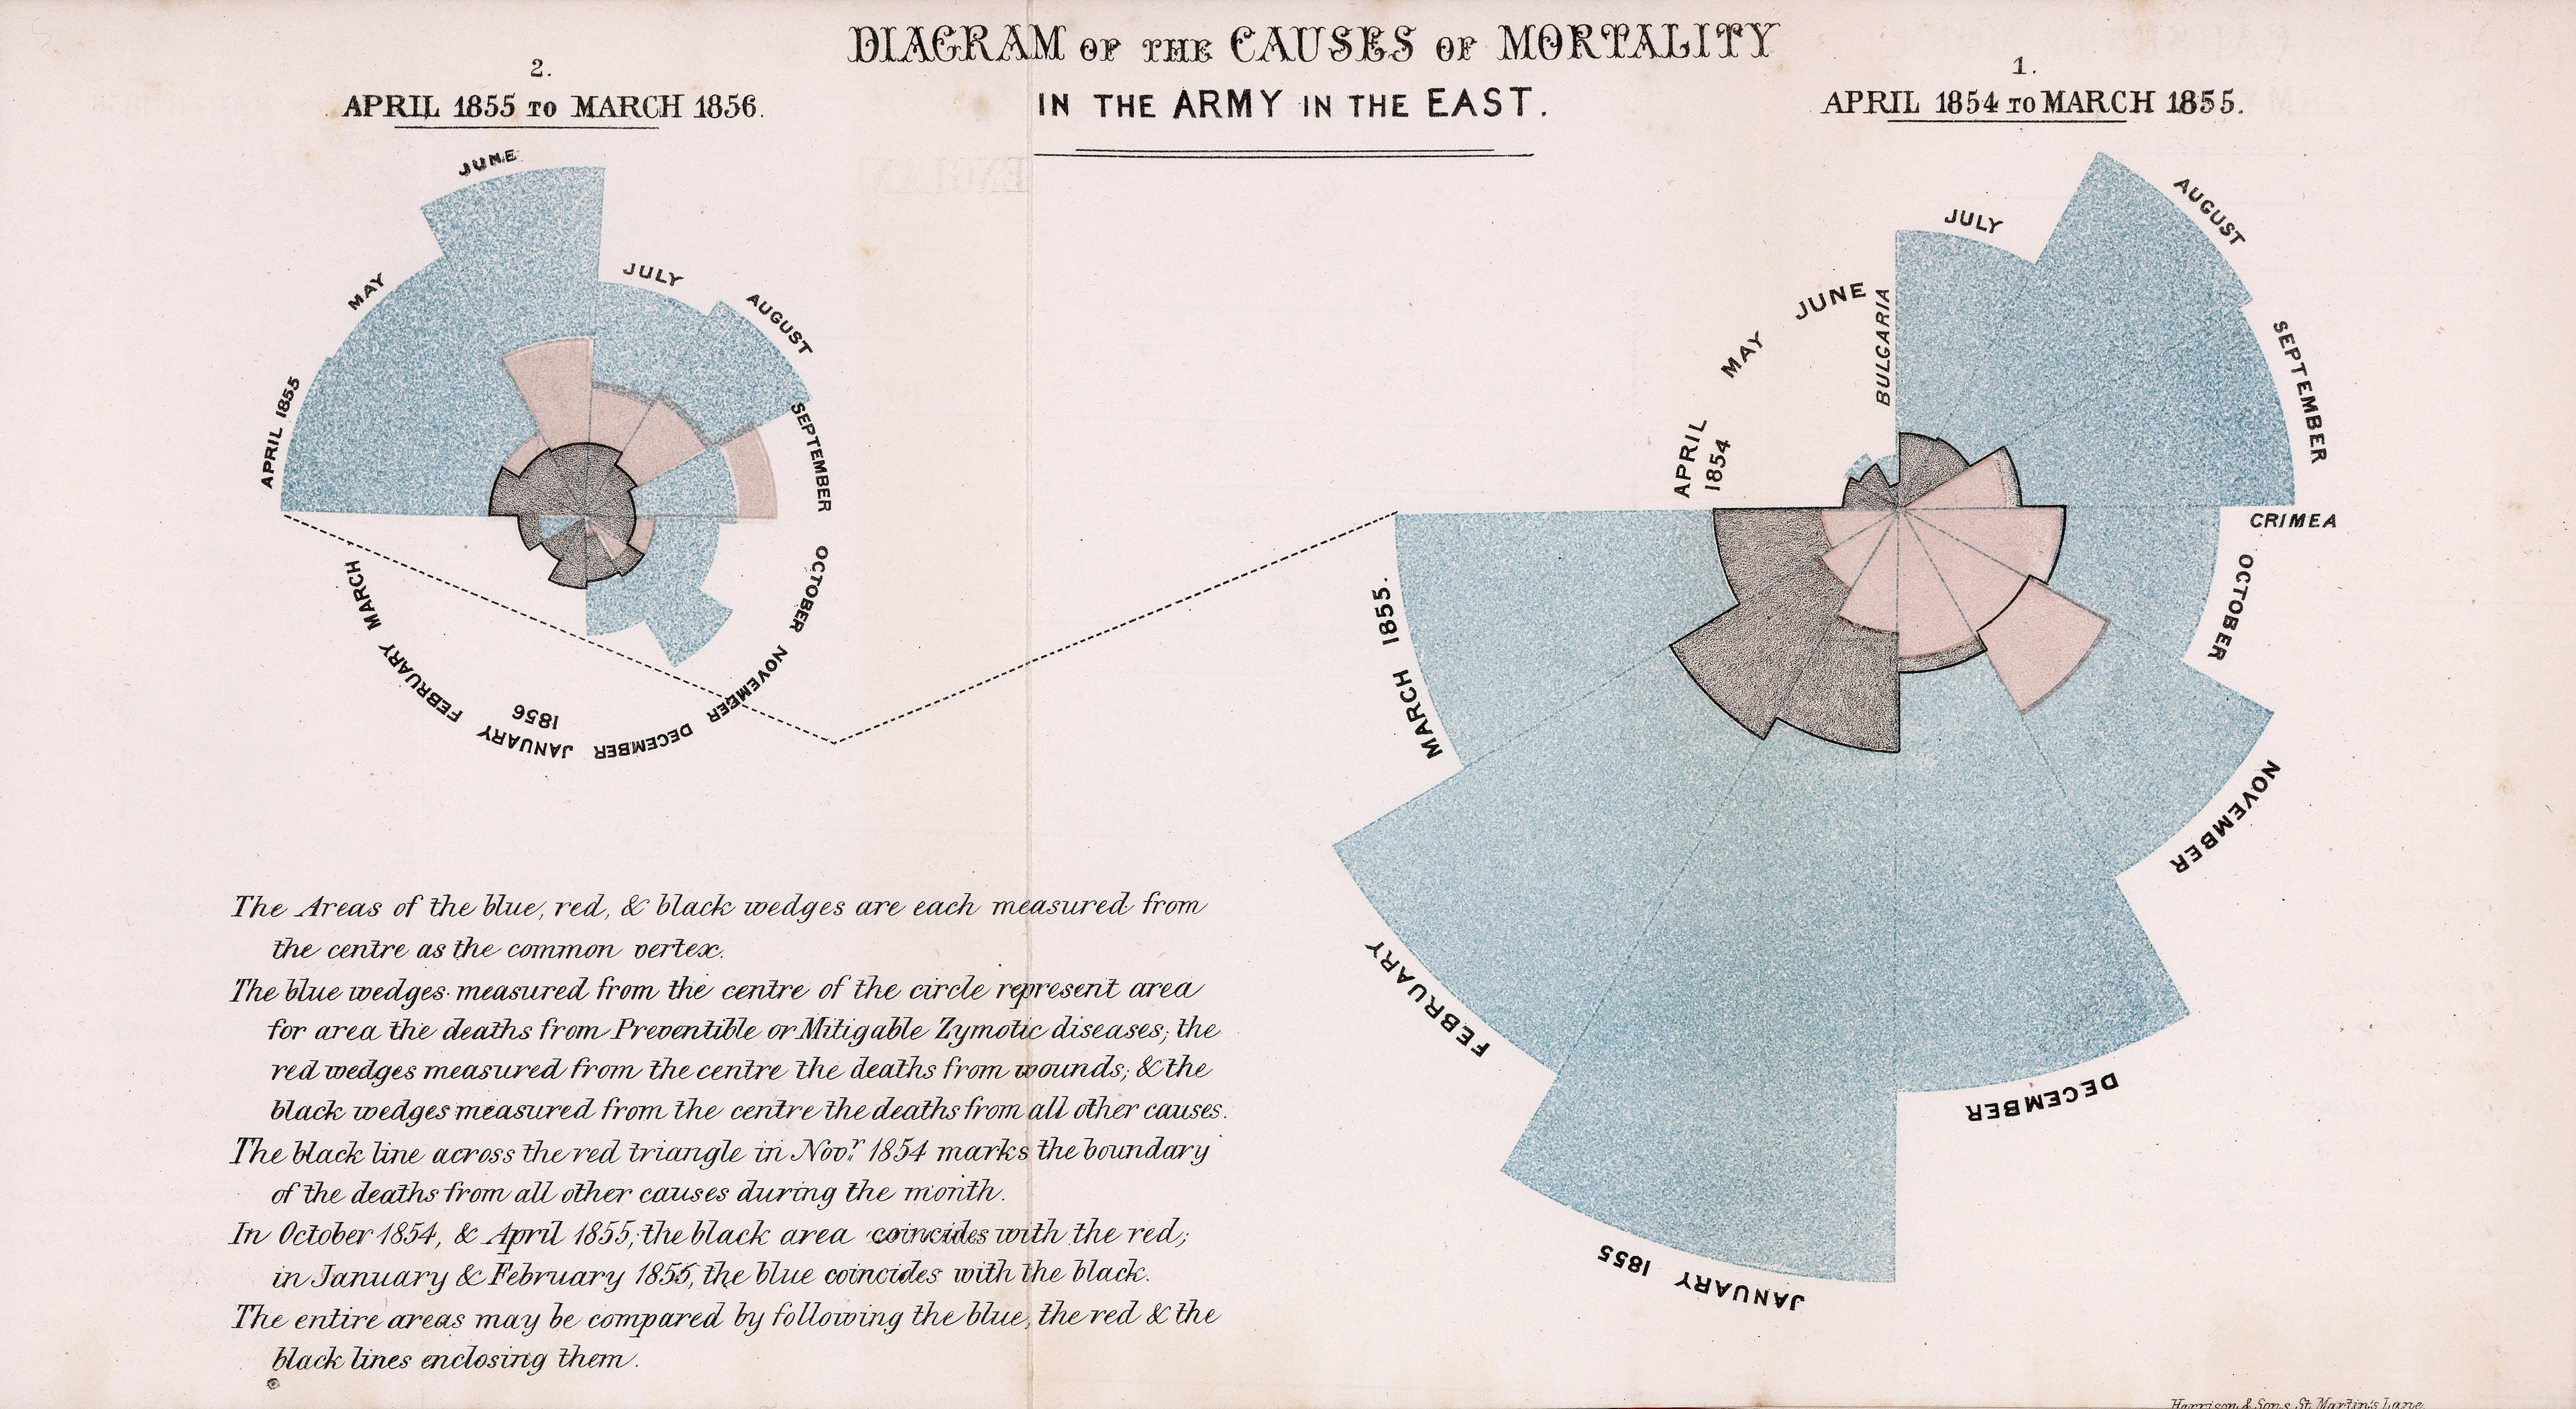
Nightingale published her diagram in 1859, in A Contribution to The Sanitary History of the British Army.
“In the Royal Commission’s report it is stated that ‘the tables and diagrams are furnished by Dr. Fall, F.R.S.’ They were prepared from Florence Nightingale’s illustrative diagrams and in communication with her. 2000 of this anonymous publication were printed.” – Elmer Belt Florence Nightingale collection (1958)

Would you like to support Flashbak?
Please consider making a donation to our site. We don't want to rely on ads to bring you the best of visual culture. You can also support us by signing up to our Mailing List. And you can also follow us on Facebook, Instagram and Twitter. For great art and culture delivered to your door, visit our shop.