Thought not updated since 2021, the Gallery of Physical Visualizations is a chronological gallery of physical visualisations and related artefacts, maintained by Pierre Dragicevic and Yvonne Jansen. Divided into categories – Passive physical visualizations, Active physical visualizations, Physical models, Measuring instruments, Interactive installations, and Enabling technologies – the archive is a treasure trove of experiments in making data tangible.
Visualising data matters now just as it did when English nurse Florence Nightingale used it to save lives, and WB Du Bois used illustrated data to show the state of black life in America.
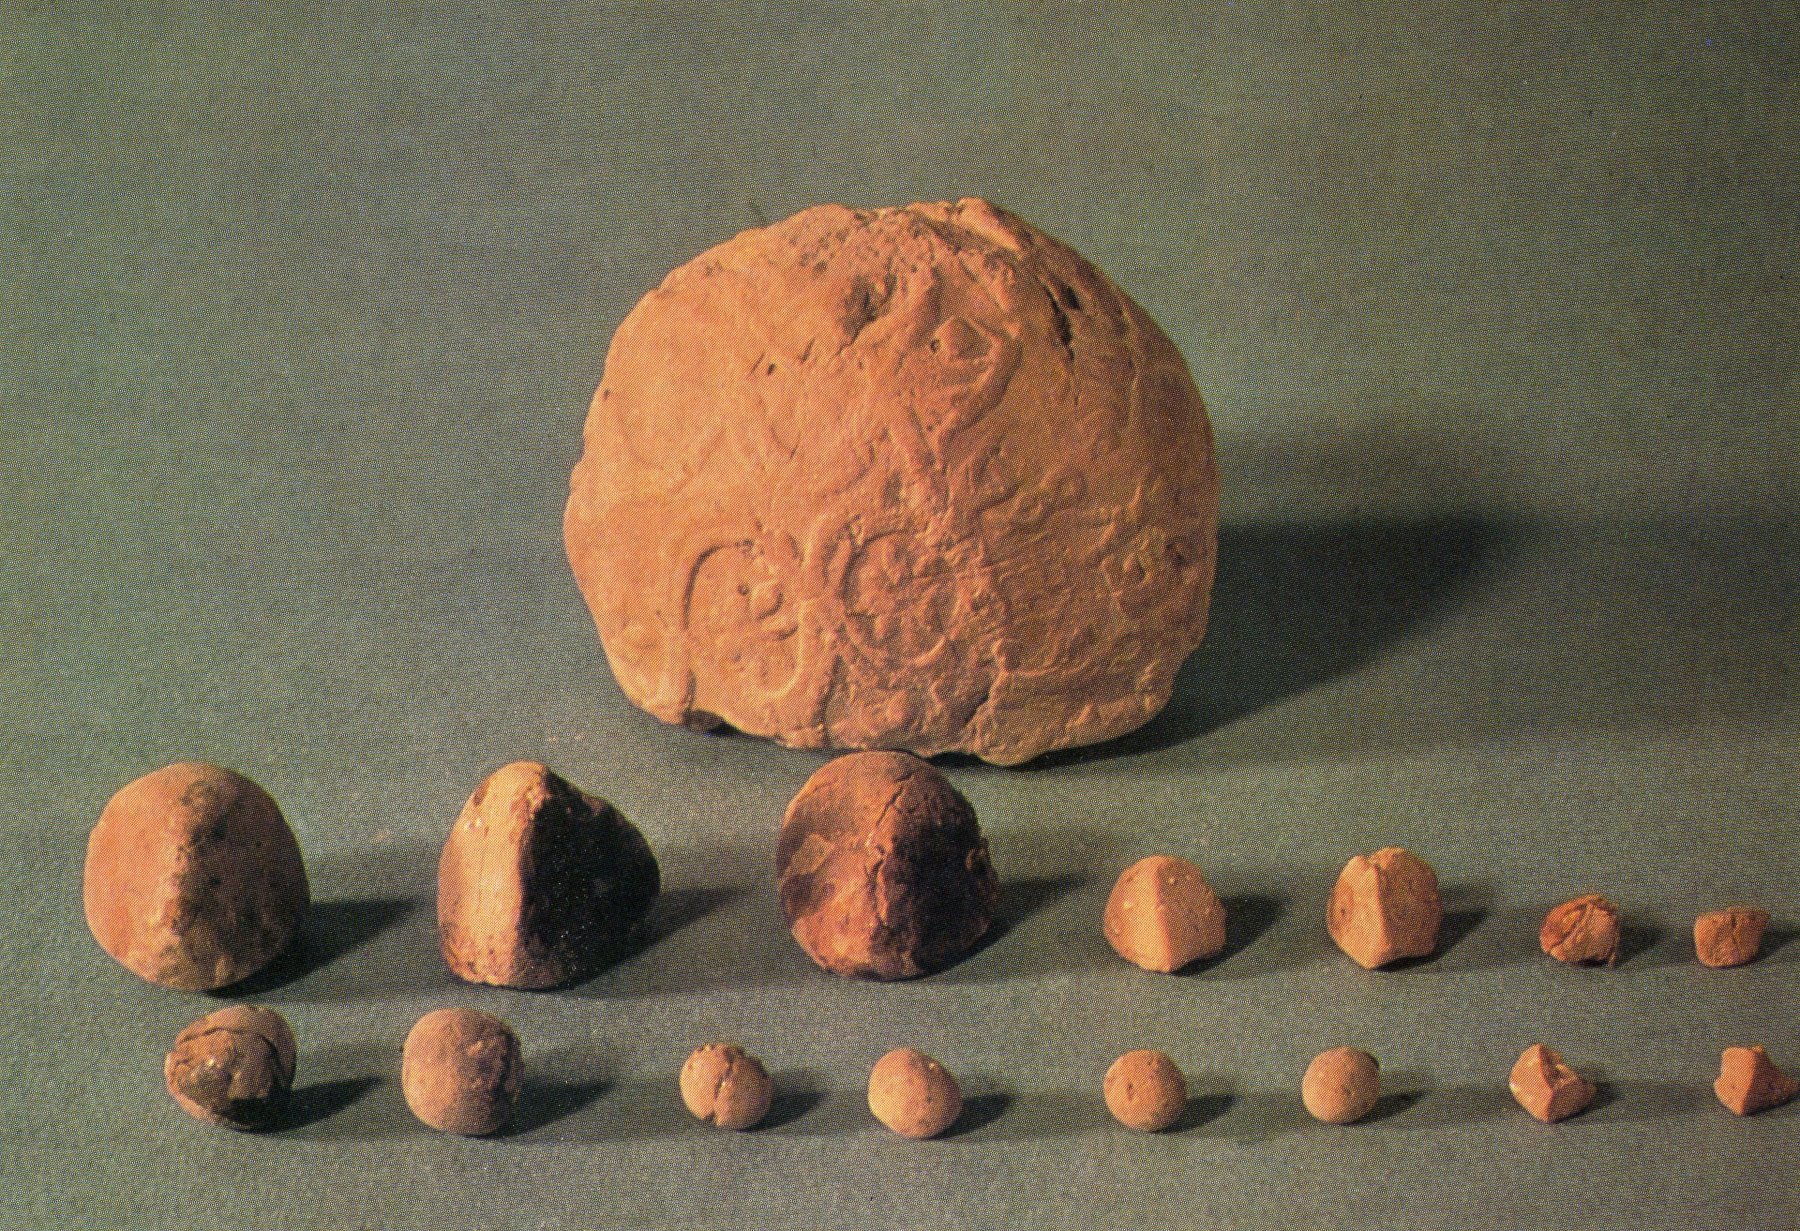
The earliest entry is for ‘5500 BC – Mesopotamian Clay Tokens‘. These tokens suggest that physical objects were used to externalise information, aid visual thinking and enhance understanding of the complex before paper was invented around 2,000 years ago in China, around 1,500 years after the advent of writing – the earliest known writing was invented around 3400 B.C. in an area called Sumer near the Persian Gulf.
Archaeologist (Schmandt-Besserat, 1999) explains:
“Whereas words consist of immaterial sounds, the tokens were concrete, solid, tangible artifacts, which could be handled, arranged and rearranged at will. For instance, the tokens could be ordered in special columns according to types of merchandise, entries and expenditures; donors or recipients. The token system thus encouraged manipulating data by abstracting all possible variables… No doubt patterning, the presentation of data in a particular configuration, was developed to highlight special items . “
Sources:
- Denise Schmandt-Besserat (1999) Tokens: The Cognitive Significance.
- Denise Schmandt-Besserat (1996) How Writing Came About.
- Image taken from en.finaly.org (photo Denise Schmandt-Besserat)
1862 – Marshall Islands Stick Charts
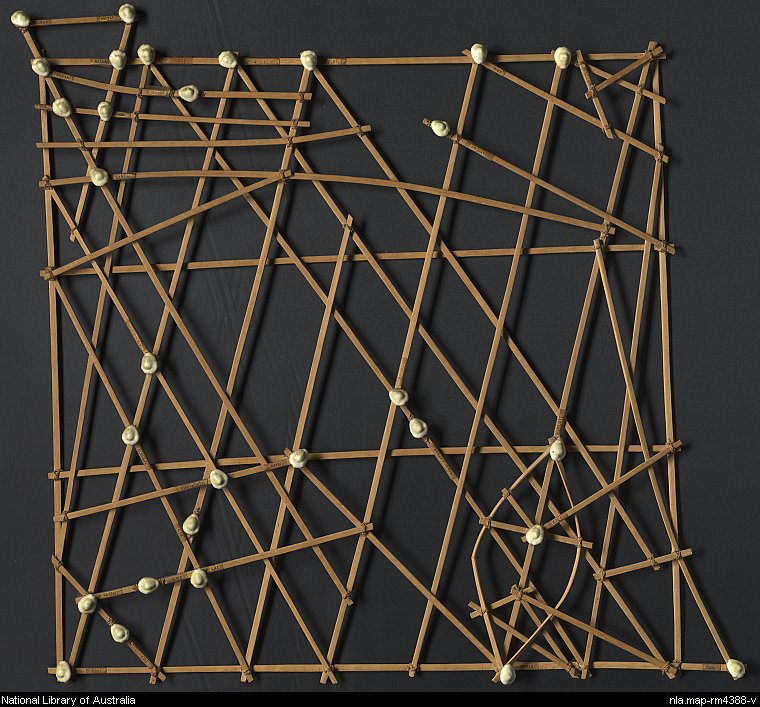
These physical visualizations show ocean swell patterns, and were built by native Micronesians from the Marshall Islands to facilitate canoe navigation. They were memorized before trips. The Western world remained unaware of the existence of these artifacts until 1862.
The photo above is a stick chart from 1974. Straight sticks represent regular currents and waves, curved sticks represent ocean swells, and seashells represent atolls and islands.
1901 – Davenport’s Physical Distributions
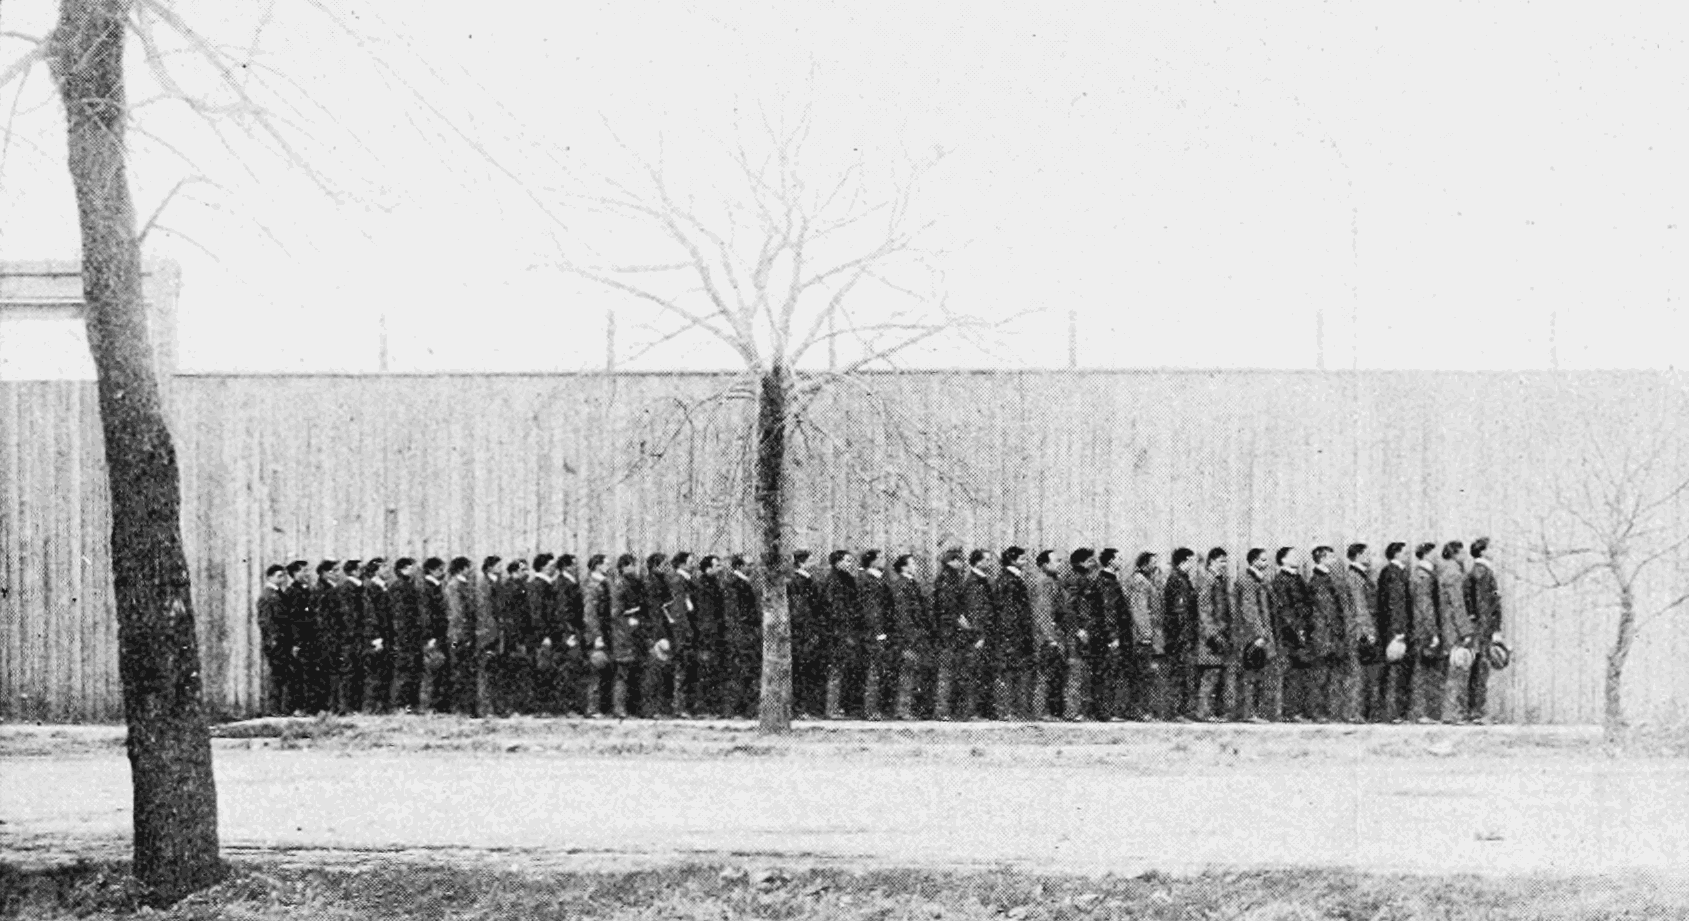
University of Chicago students in order of height
In 1901, biologist Charles Davenport “built” physical visualizations that show the distributions of features of objects and people. These visualizations were made out of the objects and the people themselves. The purpose was to explain the notion of statistical distribution to a lay audience. On the left image, seashells are piled up according to how many ribs they have. On the middle image, students are arranged in bins according to their height. On the right image, they are simply sorted.
Charles Davenport’s research on eugenics may be controversial. Nevertheless, his explanation of statistical distributions has a clear pedagogical value. His examples also show that spatial arrangement is a key feature of data visualizations, and that a good spatial arrangement can augment cognition even without the use of abstract mappings and encodings.
Source: Davenport (1901) The Statistical Study of Evolution.
1915 – Wire Models of Factory Worker Movements
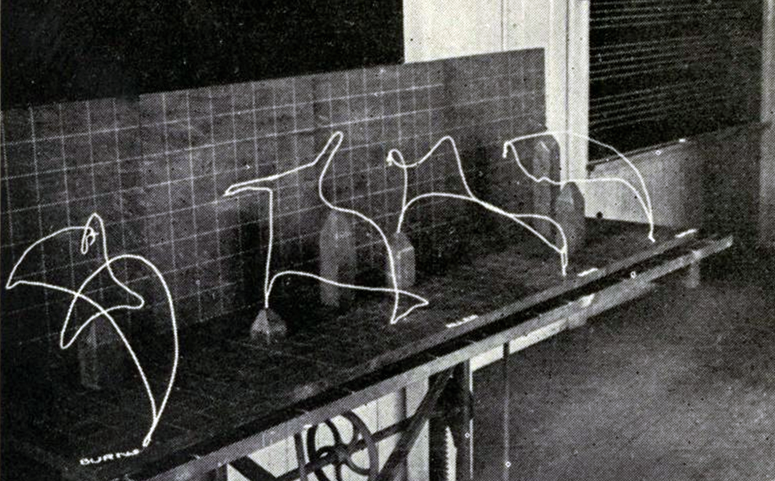
3D wire models of hand motion paths (or chronocyclegraphs) created by Frank Gilbreth, a pioneer in the study of motion in the workplace. In his 1917 book, Gilbreth explains how he created these solid models from time-lapse photographs, and how useful they are to study and teach human motion.
First photograph of wire models showing one man’s progress of learning paths of least waste. These wires represent the paths of the left hand of a manager on a drill press, – a machine which he had not touched for twenty-five years.
Sources:
- Régine Debatty (2012) The Chronocyclegraph.
- Everardo Reyes-Garcia (2014) Explorations in Media Visualization.
- Frank Bunker Gilbreth (1917) Applied motion study; a collection of papers on the efficient method to industrial preparedness.
- Left image from Régine Debatty, right image from archive.org.
1920 – Yakama Time Ball
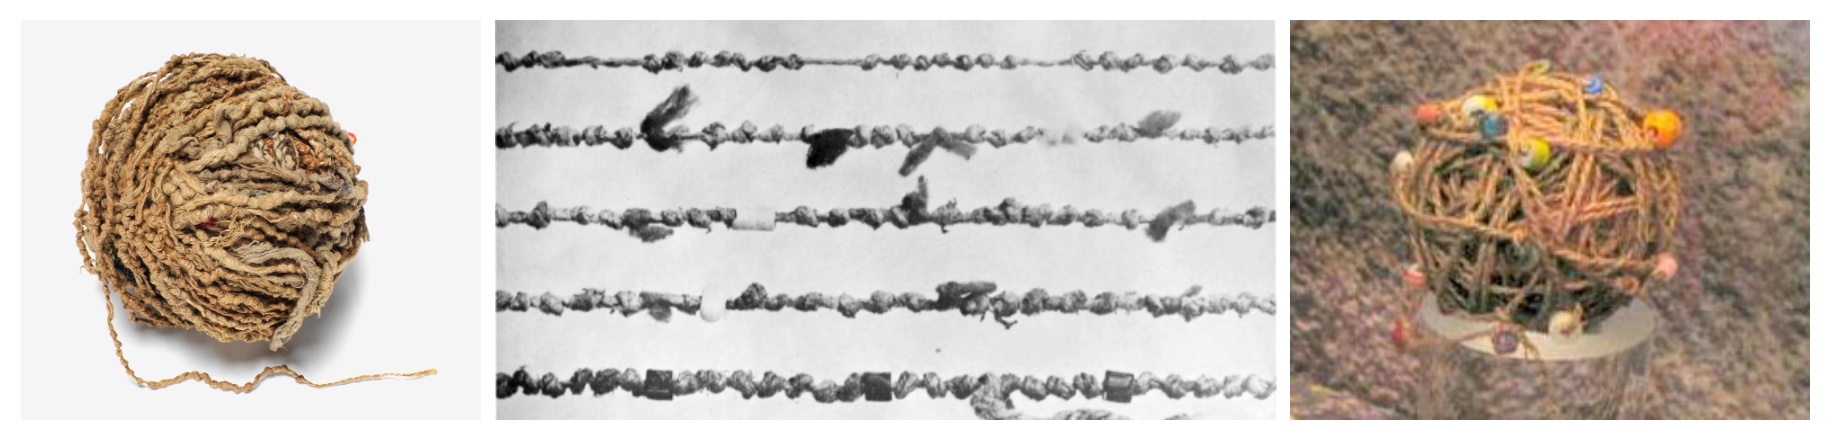
Women from the Yakama Native American tribe used strings of hemp as personal diaries. Each major event in their life was represented by a knot, a bead or a shell. This mnemonic device is called an Ititamat, or counting-the-days ball, or simply time ball. The first image shows an Ititamat created before 1920. On the second image, each string is a different Ititamat. The last image shows a 2003 replica.
A young woman would use a time ball to record her courtship, marriage, and other experiences using a system of knots and beads that only she could decipher. As she grew older, a woman might have several time balls with which to share her life story or keep those memories private. When she passed on, they were buried with her.
The ball of twine grew in size as time passed and as events occurred. The women would sometimes divide the twine into 25-year lengths to make it more manageable. When the women were very old, they could use the knots and beads of their time balls to recall not only what happened in their lives but when the events occurred. They could easily recount when their children were born, when they moved away, and other major experiences.
Sources:
- Helen H. Schuster (1990) The Yakima. pp. 33-35.
- Lone Grey Squirrel (2007) Time Ball.
- Marjanović D., Štorga M., Škec S., Bojčetić N., Pavković N. (2018) Data Objects: Design Principles for Data physicalization.
- First image from the Cooper Hewitt Smithsonian Design Museum.
- Second image from Schuster’s book (ibid). p. 35.
- Third image from ideiasdefora.com. Artefact exhibited in the Smithsonian Museum of the American Indian, Washington D. C.
1945 – Electron Density Map and Molecular Model of Penicillin
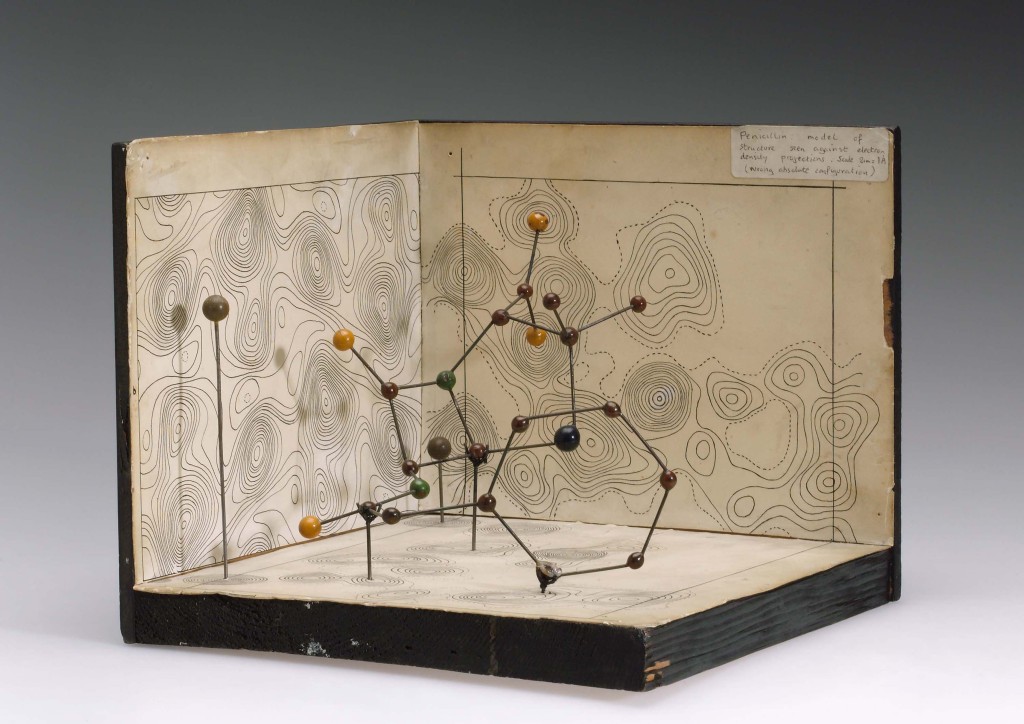
Electron density map and model of Penicillin created by Dorothy Crowfoot Hodgkin in 1945 based on her work on X-ray crystallography. The Penicillin molecule was the first molecule whose structure was derived entirely from X-ray data. Dorothy Hodgkin later received the Nobel price for applying the same technique to determine the structure of the B12 molecule.
Dorothy Hodgkin (1910-94) was awarded the prestigious and exclusive Order of Merit in 1965 to add to her 1964 Nobel Prize for ”her determinations by X-ray techniques of the structures of important biochemical substances”. The Order of Merit is a group of 24 individuals of great achievement in the fields of the arts, learning, literature and science. Hodgkin was only the second woman to be part of the exclusive group – the first was Florence Nightingale.
Sources:
- Hodgkin, Dorothy Crowfoot: The X-ray analysis of complicated molecules. Nobel Lecture, December 11, 1964.
- Image source: Science Museum, London.
- Blog of the Science Museum, London.
1947 – Dorothy Hodgkin’s Electron Density Contours
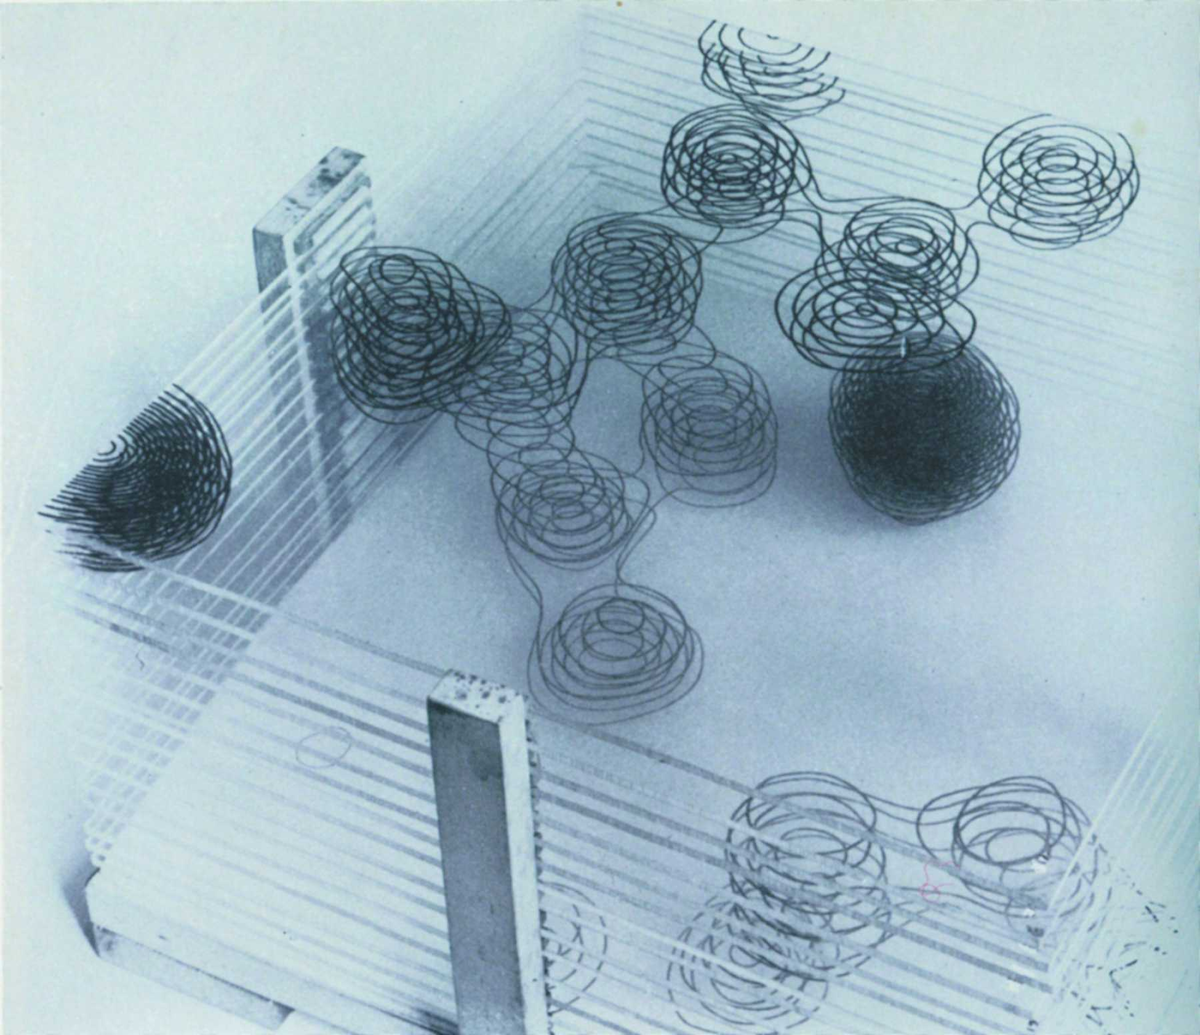
Nobel prize winning crystallographer Dorothy Crowfoot Hodgkin created another physical visualization in the mid 1940’s, showing part of the structure of penicillin. An original of this artifact is in the Oxford Museum of the History of Science. This technique recently inspired artist Angela Palmer for her glass portraits.
Sources:
- Lachlan Michael and David Cranswicka (2008) Busting out of crystallography’s Sisyphean prison: from pencil and paper to structure solving at the press of a button: past, present and future of crystallographic software development, maintenance and distribution.
- Oxford Museum of the History of Science. Model of the Structure of Penicillin, by Dorothy Hodgkin, Oxford, c. 1945.
1951 – Electricity Generated or Demanded
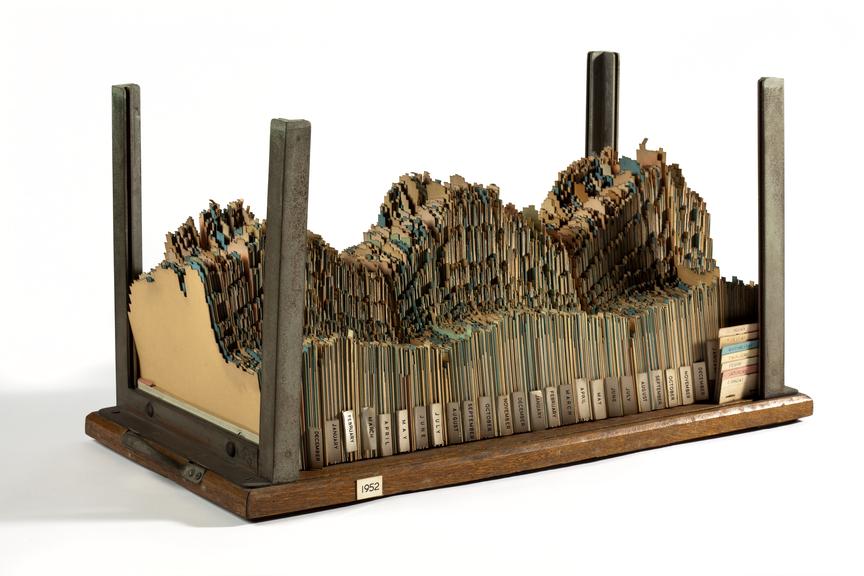
A 3D chart made out of a jagged cardboard for each year representing generated electricity and demand over time.
Three-dimensional chart used by Central Electricity Generating Board planners, c.1954. Consists of about 300 cards with square-cut stepped edges in an enclosure of chrome steel uprights, mounted on a wooden base, with a handle at each end. Data represented from October 1951 to April 1954. An early example of 3D data visualisation […]
Also see our entry 1935 – 3D Visualizations of Power Consumption.
Sources:
- Alice Cliff and Jenny Rinkinen (2018) Visualising electricity demand: use and users of a 3D chart from the 1950s.
- (CC-BY-NC-SA) Photos: The Board of Trustees of the Science Museum (link)
1965 – Stop Motion Animation of Physical 3D Map
This educational movie from the 1960s uses physical bars and stop motion animation to show the evolution of population in the Paris area between 1801 and 1961. It was made between 1962 and 1967 by the Institut des Sciences Humaines Appliquées (ISHA) and the Centre de Mathématique Sociale et de Statistique (CMSS), in collaboration with the Laboratoire de Cartographie directed by Jacques Bertin.
You can see the physical visualization from all sides by jumping at 18:40 in the video.
Sources:
- Film provided by the Archives Nationales and digitized by us.
- CAMS (2015) Histoire du CAMS.
1992 – Durrell Bishop’s Marble Answering Machine
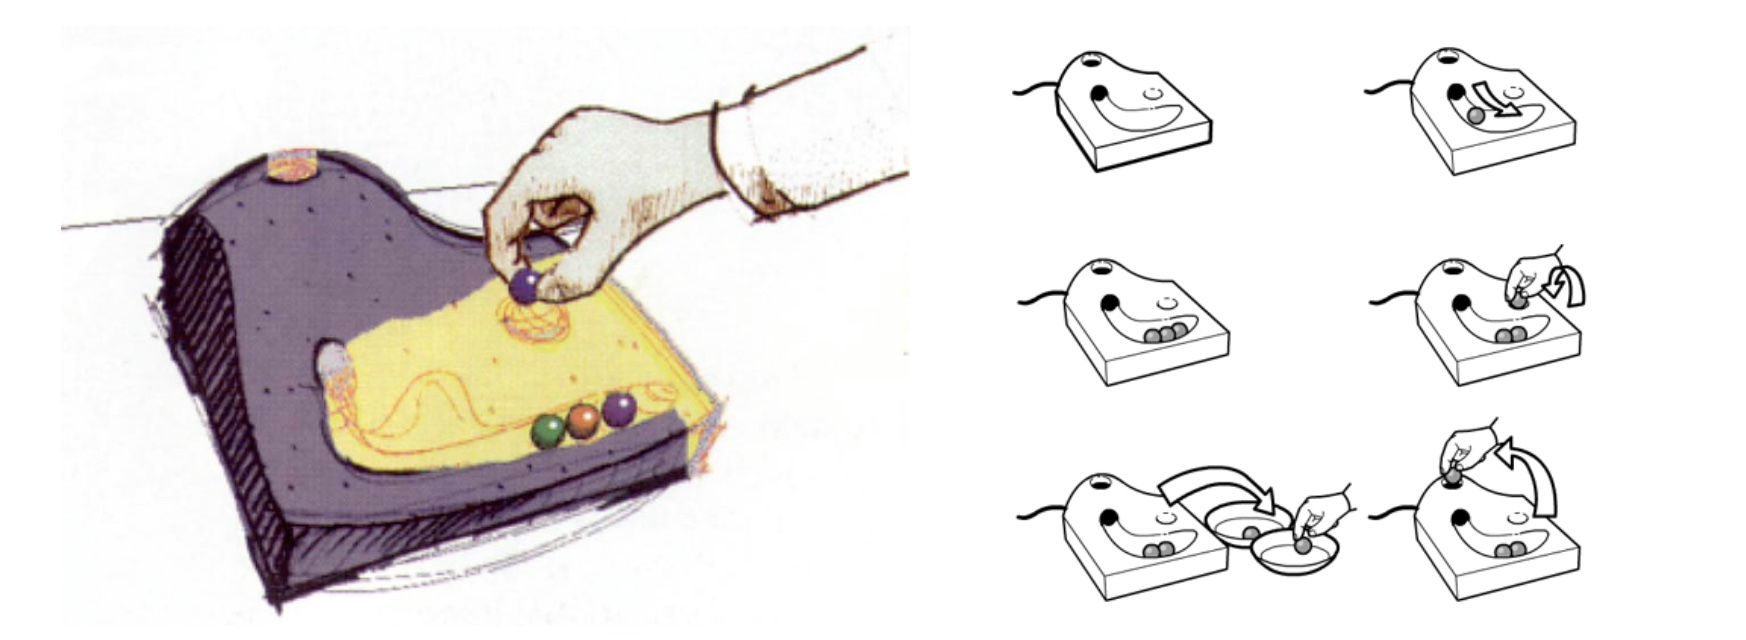
In 1992, Durrell Bishop, then a student at the Royal College of Art, came up with an original answering machine design that is considered as one of the first tangible user interfaces (TUIs). The machine spits out a marble each time an incoming voice message is recorded. The order of the marbles indicates the order in which the messages arrived. Messages can be played back by putting a marble in a small dent. If the message is for somebody else it can be placed on a small dish to the side that can be labeled with names of different persons. The telephone itself also has a small receptor area for the marbles and by placing a message there, the original caller gets called back. See the video.
Sources:
- Yvonne Jansen (2014) Physical and Tangible Information Visualization, p.12.
- R. Polynor (1995) The Hand that Rocks the Cradle.
- Left image from DocStock, right image by Matt Jones.
2019 – Self Knitted Scarf of Train Delays
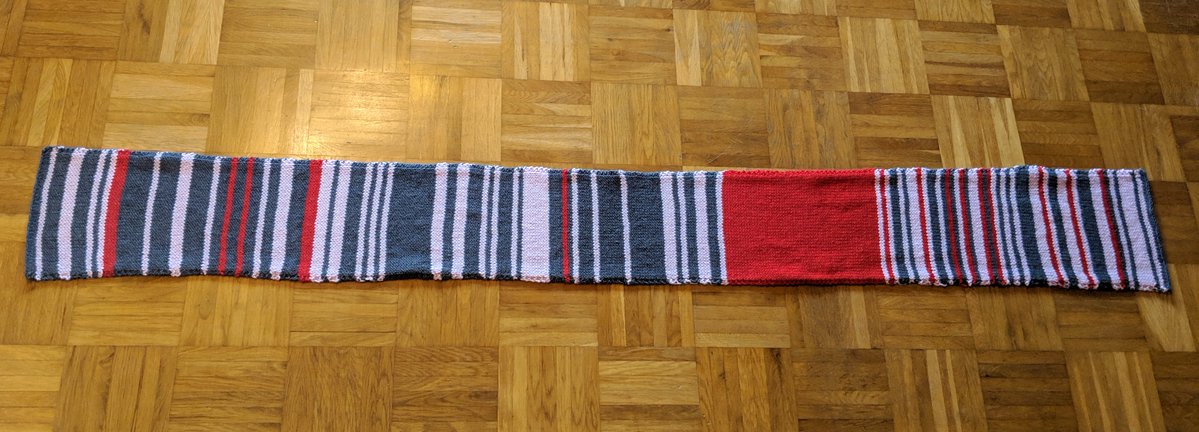
The mother [of] Sara Weber knitted this scarf during her daily train rides to work in Munich and used different colors depending on train delays. Every day two rows: Grey, less than 5 minutes delay. Pink, 5 to 30 minutes delay. Red, both rides delayed or one more than 30 minutes. The huge red area was during construction work, where the train was substituted by a bus.
Side note: The tweet went viral and at the end she sold the scarf at eBay and gave the money to the “Bahnhofsmission” who take care of homeless people at trainstations.
Sources:
- Sara Weber on Twitter: https://twitter.com/sara__weber/status/1081950904671240192
- Zett Newspage: https://ze.tt/mit-einem-selbst-gestrickten-schal-zeigt-eine-pendlerin-wie-haeufig-ihre-bahn-verspaetung-hat/
Via: dataphys
Would you like to support Flashbak?
Please consider making a donation to our site. We don't want to rely on ads to bring you the best of visual culture. You can also support us by signing up to our Mailing List. And you can also follow us on Facebook, Instagram and Twitter. For great art and culture delivered to your door, visit our shop.

